Michael Grantham
Quantitative Software Engineer
Building high-performance simulation systems.
Columbia (In Progress) B.S. Applied Mathematics
Texas A&M (2022)
I started programming as a teenager, doing web development and other little projects. I took a quick detour in Mathematics, but found I couldn't stay away from coding. Programming is my passion, and I am focused on high-performance and statistical computing.
At work, I write Monte Carlo simulations and low-latency systems to provide real time odds for sports betting markets, working primarily in C# and Rust. Previously, I wrote simulations in C++ for gaming devices, and conducted statistical analysis of games in R and Python.
At home, I've been working on more simulations and in geospatial data; you'll see that reflected in my projects.
On the weekends, I am a Company Commander in the Army Reserve. I have spent my entire adult life so far serving, and it has helped me build the discipline, resilience, and confidence that I bring to all areas of my life.
At night, I am working on my Master's degree in Statistics. Broadening my knowledge into the applications of my craft is making me a better and more thoughtful developer.
I will never stop coding; every day I want to learn and create, and I will share some of my personal work here.


-
ResponseSight LLC
Predictive modeling and simulation tools for Emergency Services. Combines my background in EMS with programming and statistics to help departments make data-driven decisions about staffing, station placement, and policy.
responsesight.com -
Lock-Free Progress Bar
I wanted a progress bar for the simulation models I am working on for ResponseSight, but needed a high performance, parallel capable solution that looked good. I figured this would be useful to have for other projects, and split it off into a Rust crate.
GitHub Repo Rust Crate -
Personal Relationship Manager
I try to keep up with all of my friends and family, but sometimes its hard to decide who to call when you have a moment. I wanted an app to track all of my relationships and interactions and reccomend who talk to next. I built this simple CRUD app using Rust and PostgreSQL as a way quick exercise in a "regular" app. Hacking together the Swift UI still, but the backend is up on GitHub.
GitHub Repo -
Storm Tracks
Visualizer for tropical cyclones. Pulls data from the National Hurricane Center four times daily and displays results from various predictive models.
View Project
Older projects worth sharing that I no longer maintain.
-
Mancala AI 2024
Evolutionary algorithm built with PyTorch to play Mancala. Created because I was tired of losing.
Jupyter Notebook -
Square Q 2022
Visualizing ANOVA post-hoc analysis. A method for displaying Tukey HSD Test comparisons more efficiently as group numbers increase.
See Details -
Chaotic Dynamical Systems 2021
Independent study presentation on chaotic dynamical systems and mathematical theory.
Read Presentation -
Spotify Graph 2020
NodeJS app that visualized your Spotify library as a histogram of album covers stacked by year.
-
Waffle House Cardiac Disease Correlation Map 2018
Heatmap correlating cardiac disease deaths with Waffle House locations—an interesting commentary on correlation vs. causation. Winner of Best Cartographic Design at the NJDEP Mapping Contest.
-
GeoCloud 2016
Full-stack collaborative mapping application built in high school. Featured Google Maps integration, relational database design with stored procedures, and a mobile-friendly interface for collecting and sharing geospatial data.
Paper
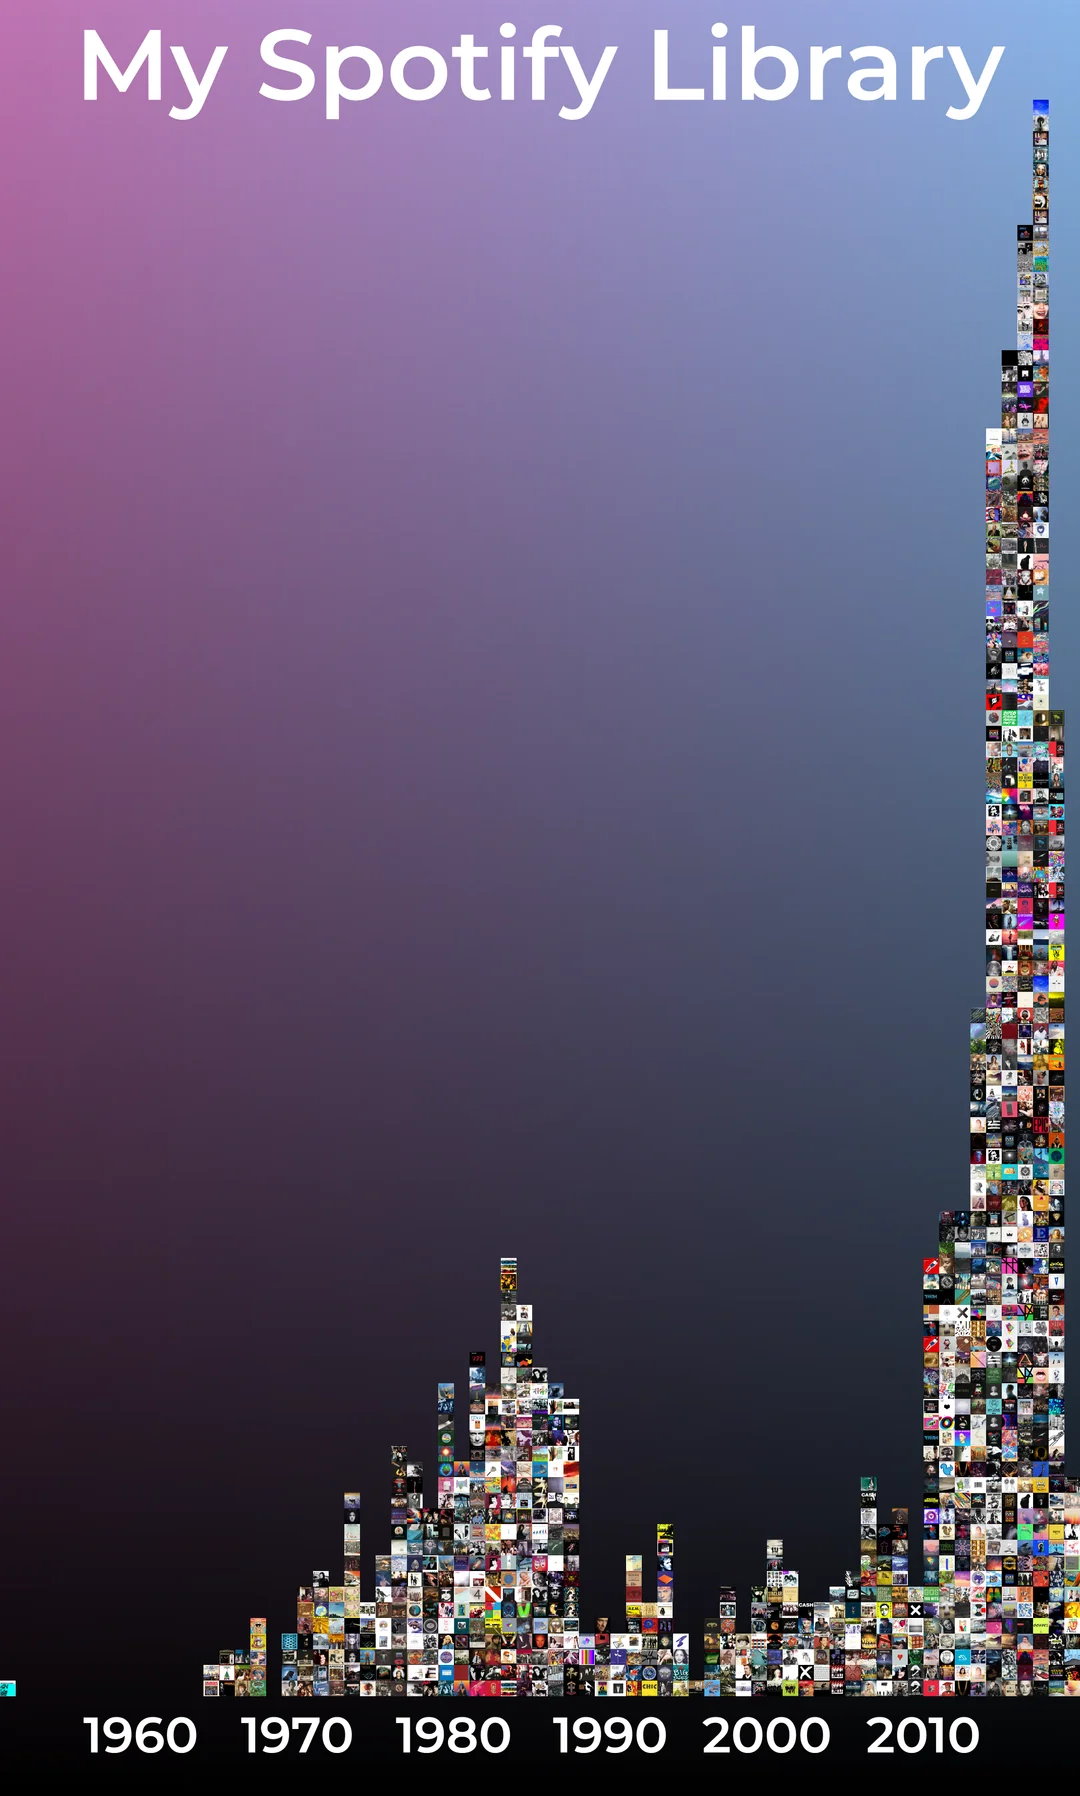
Spotify Graph — Album covers stacked by release year

Waffle House Cardiac Disease Correlation Map — Best Cartographic Design, NJDEP 2018